Are you a Google or Microsoft shop? The data says you’re both
There’s no doubt that the contest between using Google vs Microsoft in the workplace is a heated one. From visual interface to functionality, many people find themselves drawn to one side or the other. And when employees are forced to bat for the other team, there’s usually a series of struggles in getting used to something different.
That’s why many organizations choose one suite of tools or the other. By implementing the same systems and formats across the enterprise, it helps to remove the guesswork when it comes to using important apps like email and shared drives.
Or does it?
We wanted to take a data-driven approach to answering the question: Do people go all in on Google vs Microsoft? Leveraging Productiv’s SaaS management engagement analytics data across billions of data points, we wanted to see if we could better understand how Microsoft and Google are intertwined within enterprises.
Our conclusion? the line between being a loyal Google shop vs. a true-blue Microsoft outfit is blurry. Here’s what we found when we pulled the numbers:
About Our Google vs Microsoft Data
Before we get into specifics, let’s talk about the data itself. As a leader in SaaS Management, Productiv focused on deep SaaS engagement analytics to determine which applications are truly giving your business value. For this study, we compiled data from Productiv customers who have more than 50 users per week in either Gsuite or Microsoft products, and then correlated this usage with other key applications.
Specifically, we looked at usage rates for the following:
- Microsoft Outlook
- Microsoft OneDrive
- Office365 Teams
- Office365 Sharepoint
- Gmail
- GSuite Sheets
- GSuite Docs
- GSuite Meet
We also wanted to see how usage rates of Microsoft and Google products compared to other best-in-breed tools within those same organizations, including Box, Okta, Slack, and Zoom.
The result is an apples-to-apples comparison of the percentage of organizations who use specific tools on a weekly basis. Though many companies consider themselves to be rooted firmly in the Microsoft or Google fandom, we discovered that there’s actually quite a bit of overlap.
For example, of the organizations that have a 100% adoption rate of Gmail, 4% of them are also using Outlook as an email client.
Here are some of the more telling insights we pulled from our data and what this means for an organization’s app stack moving forward:
Google Products are Popular with Microsoft Users
During our research, we discovered that both Google-loving companies are using Microsoft products, while Microsoft-focused companies are using Google products. But Google products appear to be a slight favorite in this race.
For organizations with a 100% adoption rate of Outlook, 6% of those organizations are also using Gmail, 29% are using Google Sheets and Google Docs, and 12% are using Google Meet.
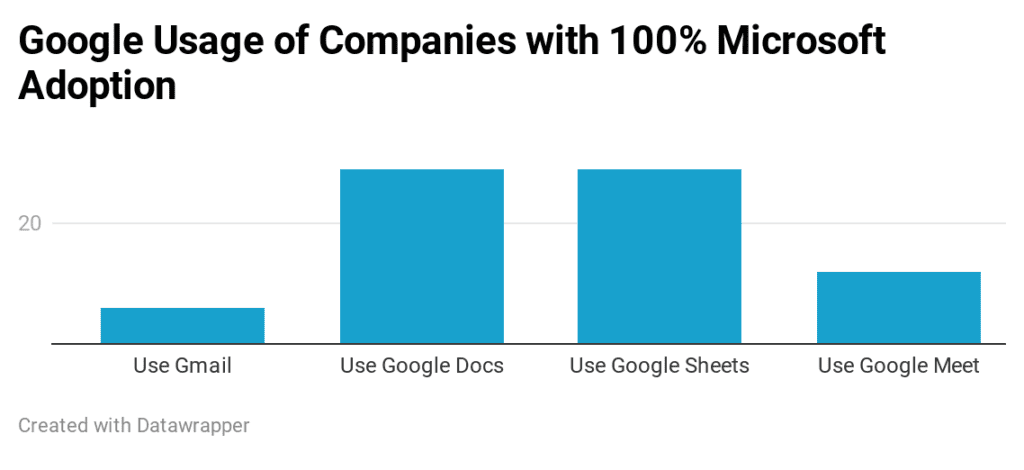
These are higher numbers than those of Gsuite companies who are also using Microsoft products. Of the companies that have a 100% adoption rate of Gmail, Google Sheets, and Google Docs, 4% of them are using Outlook, 26% are using OneDrive, 13% are using Microsoft Teams, and 9% are using Sharepoint.
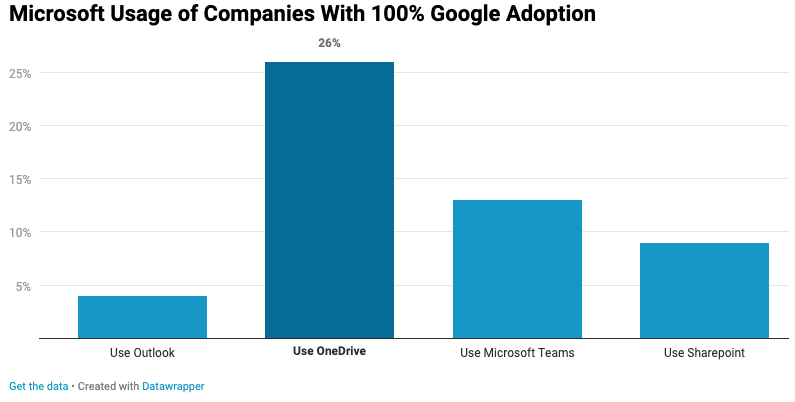
What’s more, our data indicates that Google-loyal companies have higher adoption rates of Google products (Gmail, Sheets, and Docs, specifically), where this isn’t the case with Microsoft-rooted companies. Even when Outlook has a 100% adoption rate, OneDrive only has 94% usage, Teams has 65% adoption, and Sharepoint boasts a 71% adoption.
OneDrive is a Favorite Among Google Workspace Users
Despite our data showing a 100% adoption rate for Google Sheets and Google Docs among companies embedded in Google Workspace, Microsoft OneDrive maintains a 26% adoption rate for these same companies.
Google Drive and OneDrive share many similar concepts, but the two aren’t exactly the same. For example, Google Workspace is cloud-native, while OneDrive works with desktop Microsoft Office apps.
Diving deeper into each organization’s data to see exactly how these tools are being used by employees can help explain the overlap in tools.
Best-of-Breed Technologies Have High Adoption Rates
Another interesting take away from our research is the use of other best-of-breed technologies alongside similar tools offered by Google and Microsoft.
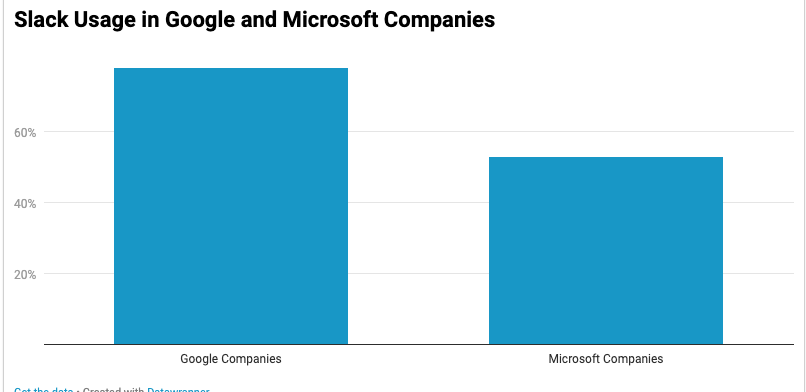
For example, Microsoft developed Microsoft Teams, a chat-based app, to streamline workplace discussions and improve collaboration. And yet, 53% of organizations that are all-in on Microsoft products are also using Slack, another chat-based app designed for quick communication and collaboration. In Google-based organizations, 78% of users are using Slack for team communication.
Speaking of collaboration tools, both Google and Microsoft offer powerful cloud-based drives and tools. These are designed to assist with sharing files, storing and accessing content from anywhere, and improving collaboration among teams. But teams are also using popular tools like Box on a weekly basis for content collaboration.
Box is a cloud content management service that makes it easy to share files inside and outside of the organization. In Microsoft organizations, 47% are using Box while Google user rates are at 39%.
Last but not least, everyone’s favorite video conferencing app Zoom is giving Google Meet a run for its money.
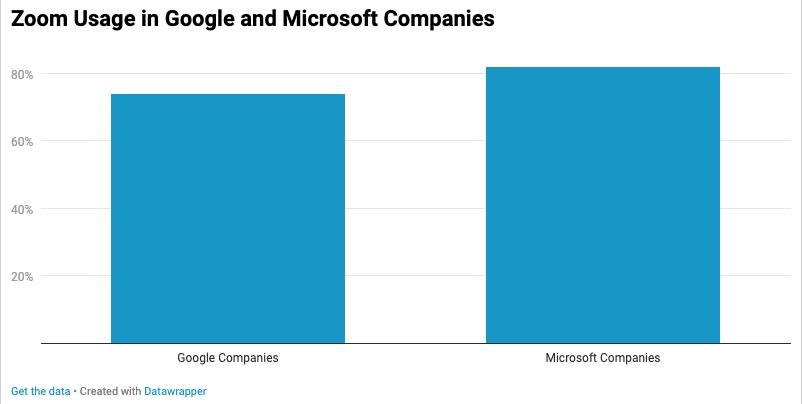
Of the 83% of Google users who choose Meet on a weekly basis, 74% are also using Zoom. It’s also popular in the Microsoft culture, with 82% of users engaging in a Zoom meeting every week.
Key Takeaway: App Insights Matter
The answer to the titular question “Are you a Google or Microsoft Shop?” is clear:
Many organizations are both, in one way or another. The data proves it!
From an application perspective, an important realization for organizations is that employees are eager to take the path of least resistance when it comes to using tools to get the job done. Even when you’ve invested in either Microsoft or Google, employees who prefer the other are likely to follow their preferences.
As IT procurement leaders and software selection experts, it should be a goal to facilitate this approach. Make it easier for employees to get their tasks done, even if it means not being solely a Google or Microsoft shop. This also means finding out more about what employees are trying to do and introducing them to the tools and apps you already have that can help them do their job.
Doing this investigation in your own organization begins with data. Productiv is designed to help you garner these insights and add context to usage and adoption rates.
Get Productiv. See Usage. Manage Costs. Increase Productivity.
About Productiv:
Productiv is the IT operating system to manage your entire SaaS ecosystem. It centralizes visibility into your tech stack, so CIOs and IT leaders can confidently set strategy, optimize renewals, and empower employees.
Learn more today
 FEATURED POST